
Cashing out and
cashing in - what caused the BM price spike?
Our viewpoint
6 March 2020

The Balancing Market (BM) is one of the tools National Grid uses to balance electricity supply and demand close to real time. It’s needed because electricity cannot be easily stored and must be produced at the time of demand.
Where National Grid predicts that there will be a discrepancy between the amount of electricity produced and that which will be in demand during a certain time period, they may accept a ‘bid’ or ‘offer’ to either increase or decrease generation (or consumption). The BM is used to balance supply and demand in each half hour trading period of every day to address energy imbalance and system constraints.
On Wednesday 4 March 2020 at 6pm the system price in the Balancing Market spiked to £2,242/MWh – the highest level since the 30th November 2015 when the system hit VoLL at £3,000/MWh. Loss of load probability (LOLP) also reached 37% which meant there was more than a 1 in 3 chance that National Grid would have to take emergency action to prevent a power loss event occurring.
Although these occurrences normally happen when units trip off the system, this event didn’t involve any major power station operating differently from what it declared it would do. Using LCP’s real time Balancing Market trading platform ‘Enact’, we investigate what happened to cause the price spike and what could have been done to prevent it.
What happened?
After weeks of high wind output, Wednesday saw a significant drop in wind generation from an average of ~15GW at the weekend to less than 1.5GW over the evening peak of March 4th. Peak demand was 45,649MW, which is high but there have been multiple other occasions over the past year where demand has been higher. What made matters worse was that, due to low wind output, nearly every unit was already operating at full load, leaving very little head room (plant available to turn up in the BM) to provide the additional power needed to meet demand. The offer table shows the units that were offering to provide more than 100MW, but the majority of these required being turned on which meant they needed sufficient advanced notice (“NDZ” on table below, in minutes).
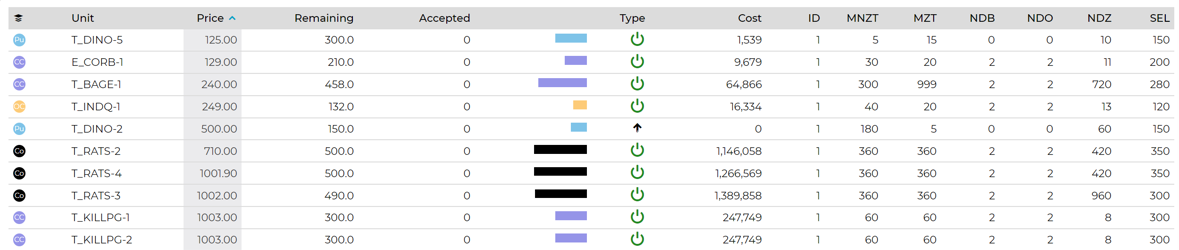
LCP Enact table showing offers available to National Grid – 4th March 2020 6:00pm
Ratcliffe 2 had been warmed earlier in the day but National Grid cancelled this instruction, so they also could not respond. As 6pm approached National Grid was facing an even lower wind output than forecast, and with limited options to increase generation they turned to Short Term Operating Reserve (STOR) units. For the purpose of the imbalance calculation, STOR units are repriced as the maximum of their utilisation price and the Reserve Scarcity Price. The extract below, taken from the Elexon regulations regarding imbalance pricing, shows that these units were repriced as 0.374 (LOLP) * £6,000/MWh (VoLL) = £2,242/MWh, and with so many of these units being used to keep the lights on they also ended up setting the system price.
Actions derived from BOAs and BSAAs that are STOR Provider Flagged, and that are accepted during STOR Availability Windows are included in the calculation of imbalance prices as individual STOR actions, with a price which is the greater of:
- The Utilisation Price for an action (the price that STOR capacity is paid when it is called upon); and
- The Reserve Scarcity Price (RSP), as determined by LOLP*VoLL.
We can see how the derated margin, a measure of the amount of available capacity to turn up, decreased to nearly zero at 6pm in the chart below, causing the system price and LOLP to spike.
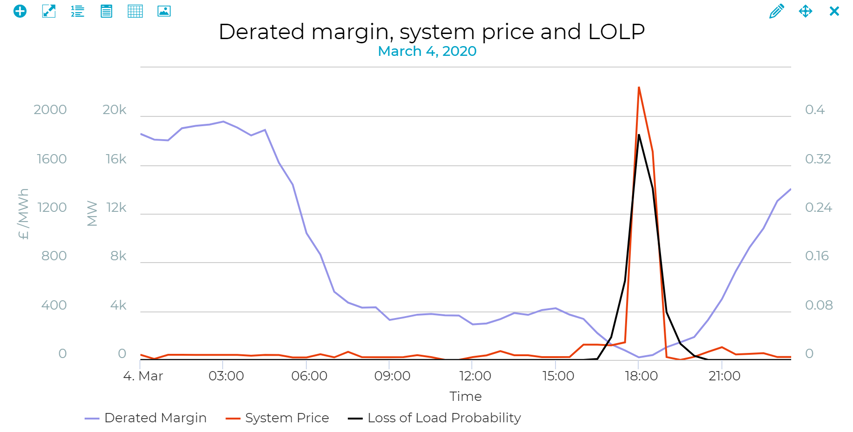
LCP Enact chart showing derated margin, system price and LOLP
What can we learn from this event?
While peak demand was high and wind output was low, the system seemed to struggle despite having a number of unused generation units that provide offers at much lower prices than the repriced STOR units. While wind was forecast to be low, the outturn was a further 2GW below National Grid’s forecast – forecasting accuracy in these tight periods is particularly important. LCP Enact’s wind forecast was showing this lower wind generation and those with a view of this stood to benefit from positioning themselves in the market.
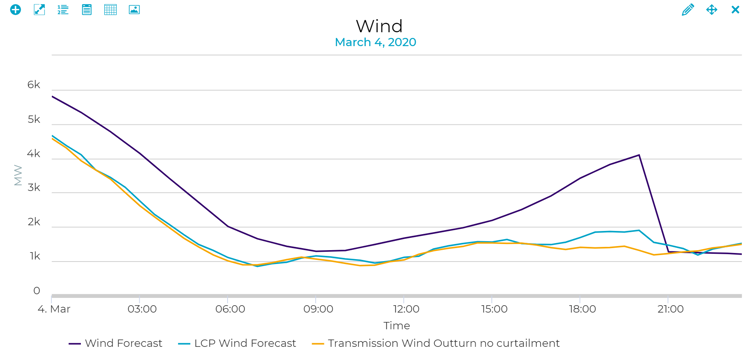
LCP Enact chart showing National Grid’s wind forecast, LCP’s forecast and wind outturn.
While some units achieved high offer prices in the BM, with some units taken at £125/MWh, the real winners from Wednesday's high system price event were units that were NIV (Net Imbalance Volume) chasing. Those NIV chasing units that spilled power during this period will be entitled to receive the system price of £2,242/MWh. As an example, if you had a 100MW portfolio of gas peaking engines all running during this half-hour period, you would earn £112,000. Conversely, those who did not generate as much power as they should have will be faced with a large imbalance bill for failing to deliver in this period.
Overall, Wednesday's events highlighted two key facts about the market - the system may still be vulnerable to future high demand and low wind events, particularly if there are any larger unit trips, and accurate data is essential to running the system in the most economic way possible, competing in the market and making profitable decisions during these events.
Bringing clarity to the complex energy market
Real-time data analytics for the GB energy market
Find out how LCP Enact can help make sense of complex data to help you make better strategic decisions.
Experience LCP Enact